Friday, 15 April 2016

Time Alignment and Gains


Basic Audio Terms:

Knowing the basic definitions of soundstage can really help you understand why certain DSP aspects are needed and how they can be implemented. So, let’s look at one of the most basic and important aspects of soundstage:

Balance: Center and Acoustic Boundaries

To properly balance your system is it important to know your stage boundaries.
In acoustics, these boundaries are defined as the left-most stage and the right-most stage.
You know a center is the point in space between two lines. Therefore, the acoustic center should be placed mid-way between your acoustic boundaries. The center shouldn’t be an artificial point on your dash: it is the acoustic center of the acoustic left and right boundaries.
It’s important to note that not all recordings have the same characteristics; some may have a vocalist to the right of center. Others may place a kick drum to the left side of the stage. Judging your center by a sole vocalist or instrument can be misleading if you don’t know for sure where that location on the stage really is supposed to be. So with that said, it’s a good idea to use correlated pink noise or a centered narrator (both provided in my Test CD) to determine center.

Depth, Width, Height
Each of these have importance as well, but I feel focusing on the center and putting that in the appropriate location with respect to your left and right boundaries will allow the other aspects to “fall in place”


Time Alignment and Levels:

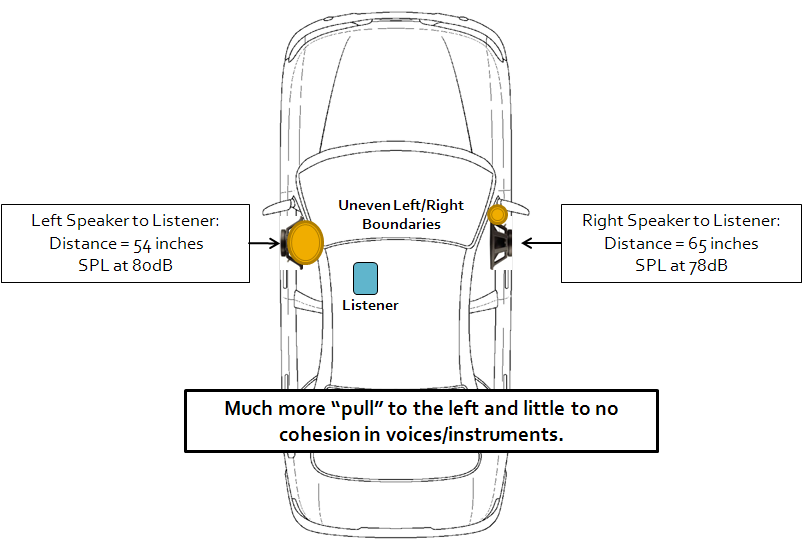
Typically, in a car, the listener is positioned so that none of the speakers are the same distance from him. 

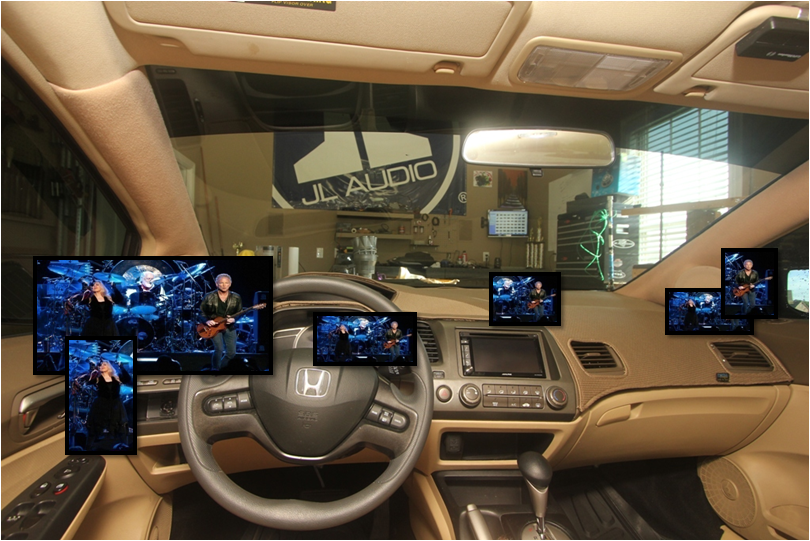
The below illustrates a standard car setup with only a single speaker on each side creating not only a near-side biased stage, but also incoherency in the sound due to poor time arrival differences. There is a clear stage boundary, but no focus and no way to really pick out a center.


In the example above, the Left/Right speaker delta is 11 inches. In time, 11 inches is approximately 0.808 ms, which means that the left speaker’s sound arrives 0.808ms before the right speaker’s sound. This would create a left side bias due to ITD.

The SPL at your seat is approximately 2dB higher from the left side. This would also create a left side bias but due to IID. 

The combination of ITD & IID would drive an overall stage that sounds squished to the left; there would be very little focus if any and no well-defined acoustic boundaries or center.


Given what we learned about our hearing based on ITD & IID, we can use our DSP’s time alignment and level features so that each speakers’ sound arrives to you at the same time as opposed to the nearside sound arriving first.
Of course, it should be noted that this really assumes properly acoustic polarity has already been accounted for. A simple 0/180 degree “phase” swap. In some cases wiring your speakers up in electrical polarity the correct way doesn’t necessarily mean you’ll get the correct acoustic polarity. Phase will be discussed more in the following section.

Time Alignment:

Time Alignment and Level Matching’s use is to give the impression that all sounds arrive to the listener at the same time based on ITD & IID. In short, if you want to simulate a sound arriving later from one speaker than another you add time delay and decrease the output which you want to push away. 

Time Alignment can be derived in simple (tape measure) or complex (measurement system with loop-back) manners.

The simple method is:
Use a tape measure to determine the distance of each driver from your listening position.
Measure approximately from the speaker voice coil (if you can’t see it, add the appropriate amount to the cone) to the center of your ears.
Use the following site to determine the approximate time delay needed to ensure each speakers’ sound arrives at the same time:


The complex method would be one using measurement gear to measure the impulse response of your speaker. But, this will not be discussed due to time constraints. Maybe later, though. 


Levels:

Given that levels are more dominant in regards to staging in higher frequencies, tweeters are typically the most impacted drivers when it comes to level setting between left and right. Additionally, in acoustics, each doubling of distance would result in the halving of SPL; in this case the left side’s output would *likely be stronger.
*Note: If the left speaker is aimed off axis, it would permit the higher frequency content to roll off a bit sooner thus helping to mitigate the IID bias to the left speaker. This is why some home speaker setups are aimed inward. Something to chew on.... 

There is no real easy way to adjust for levels via a calculation. I mean, there is… but real world things cause issues here:
Did you set the gains the exact same?
The environment will take a flat speaker response and make it not so flat.
Are the speakers the exact same sensitivity?
Bigger concern between driver types such as a midrange and tweeter, as opposed to two of the same midranges.


The best way to start off adjusting levels is to do so using pink noise and listening to high frequency content (>2khz) and adjusting levels until you achieve a good balance between left and right stage. Another option is to use an RTA or Phone app that will approximate the SPL at your seat from each speaker.


Using Time Alignment and Levels to create a Balanced Stage:

The ITD aspect: 
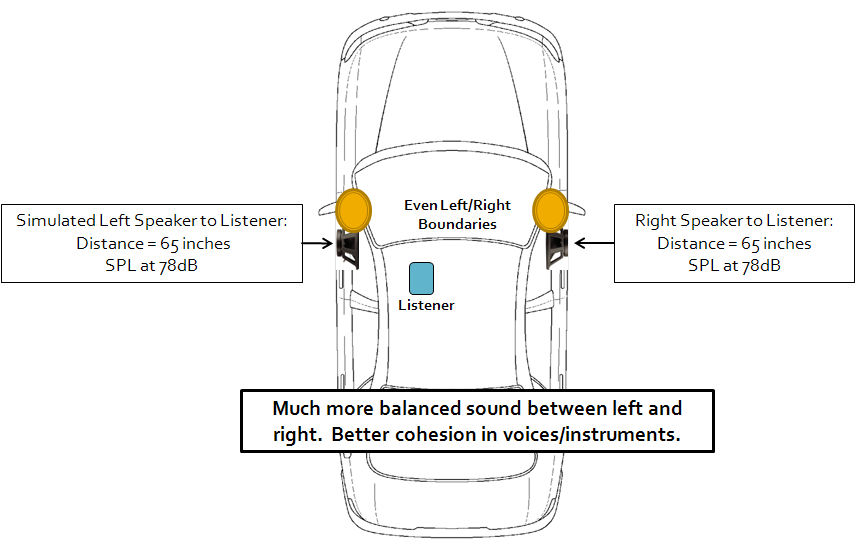
Using the simple T/A method, you determine that the left speaker delay should be set to 0.80 ms.

The IID aspect: 
You also have determined via SPL measurement that you need to attenuate the left speaker 2dB to match with the right speaker.


What you wind up with a more equal representation of left and right stage boundaries, resulting in more width and a more realistic center location for your stage. 


So, what you should now have is something *CLOSE* to this:


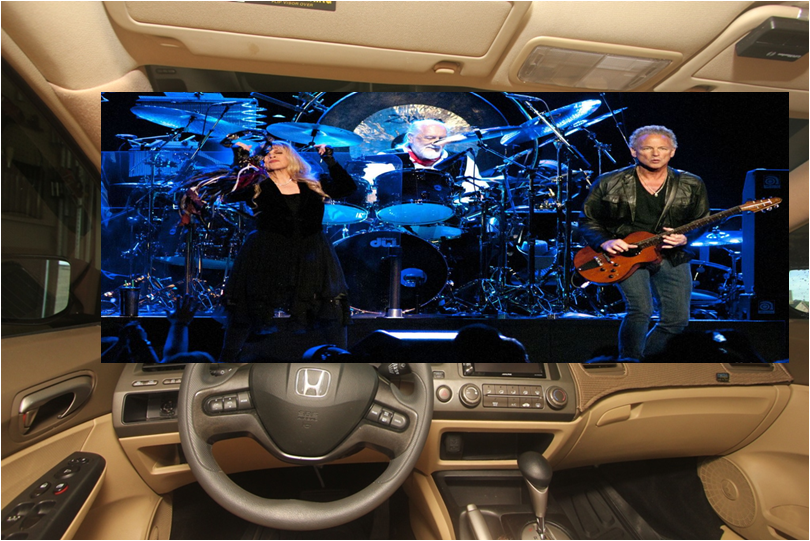
Another way to consider it is going from this ...


... to this ...


Recap:

Remember, when adjusting levels and time delay what you’re adjusting with one speaker is RELATIVE to the other speakers. You’re adjusting the nearest speaker(s) so that it sounds as if it has the same intensity and time of arrival as the furthest speaker. This would then sound as if the other speaker had moved.

Or think of it like this: you’re moving your ‘center’ with respect to the left and right boundaries. You continue to do this until your boundaries sound equidistant from the center vocalist/pink noise.
Interaural Time Delay and Interaural Intensity Difference:


Our ability to determine location of sounds is rooted in what can be boiled down to a few key points (and for the sake of this presentation will be kept very basic):

Interaural Time Difference (ITD) – Localization determined based on the time a sound takes to arrive at each ear

Interaural Intensity Difference (IID) - Localization determined based on the intensity of a sound arriving at each ear

Also known as Interaural Level Difference (ILD)


Each of these contributions can be roughly boiled down to the following*:
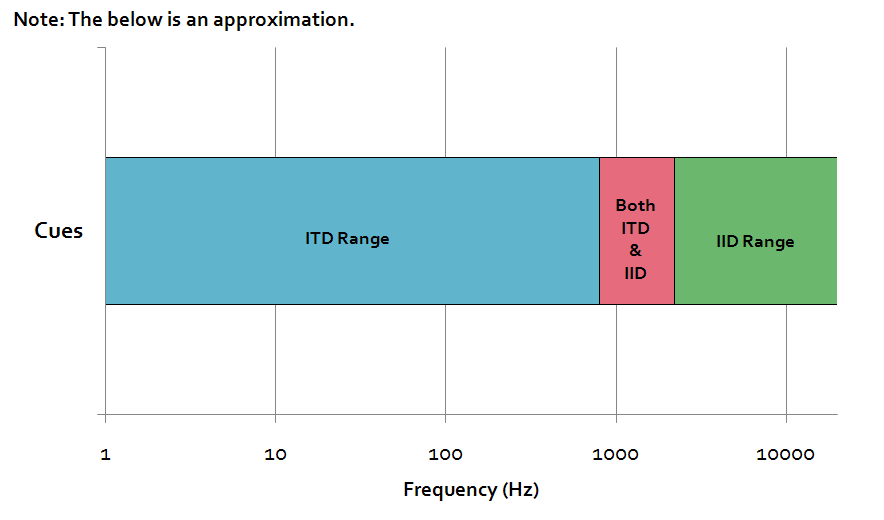
ITD cues contribute mostly up to approximately 800hz and then share with IID through approximately 1400hz where IID then takes over
* This is a summary of various research. There is additional useful information here: ITD and IID Cues


Below is a graphical representation of ITD/IID and the area where they have some overlap:


It should be noted this section does not consider any sound source other than laterally in front of the listener. For further reading on the topic, also consider the impact of the Head Related Transfer Function (HRTF) and Head Related Impulse Response (HRIR) as the “Cone of Confusion”.

Crossovers Basics


Crossovers:

Crossover Point/Slope should be evaluated as a set. Using just a number and a willy-nilly slope isn't exactly a good method to use. There needs to be some reason for setting these values. The frequency dictates at which point you want to start rolling the speaker off. The slope will dictate not only absolute and relative phase but also attenuation. 

Crossovers are made of both the frequency and the slope you use. So, let's look at that...

Crossover Frequency:

Namely, there are four aspects I am considering for low/high pass crossover values. Each of these are discussed in the driver basics section above but I will recap.
Beaming. Where does the driver's high frequency response begin to separate from on/off-axis? Using the Polar Response and Beaming reference above, you can see some of the math behind it and reasons as well.
High frequency breakup. All speakers begin to break up at some point. It's just an effect of the cone material and shape. Typically drivers don't break up until about an octave or so above their beaming point. Some drivers control break-up better than others through cone design. What you want to avoid is the area where the break up is severe enough to be heard outside of the crossover point. BUT, since this breakup usually occurs above beaming, you should be crossing before breakup occurs.
Low frequency distortion. You should know what I mean here... take a tweeter for example. If you cross a tweeter at 500hz, odds are, you're going to get all sorts of distortion and ultimately fry it. The general rule of thumb seems to be to cross the tweeter at 2*Fs (Fs=resonant frequency of the voice coil). BUT, this isn't a one-size-fits-all solution. Some drivers may have a low Fs but may not be well suited for a low crossover (ie; some drivers have an Fs of 700hz but I wouldn't run them at 1400hz full tilt with any slope). The key here, really, though is matching the dispersion pattern as well as you can to the driver before it. In the case of a 3" mid which beams at 2.5khz, you'd want to cross your tweeter somewhere in this area to keep from having a null at the crossover point, not fixed by any phase/polarity changes. Again, see the post I mentioned in #1, above.
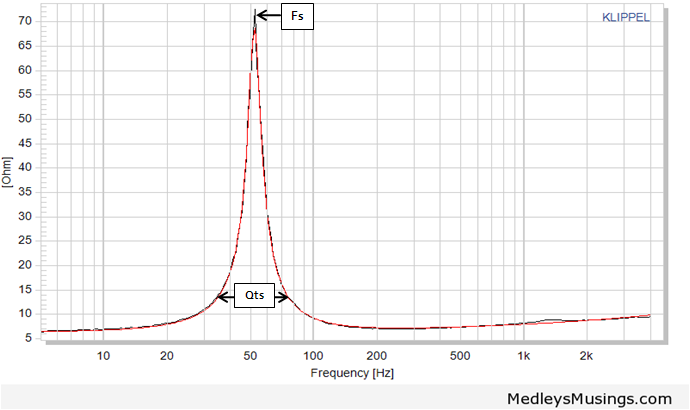
Natural Rolloff. On the low frequency end, the driver rolls off naturally. This is dictated by the Qts and Fs (the Qts dictates how much the rolloff is and Fs tells you at what frequency it occurs). These 2 pieces of information can be found in an impedance plot. Most people will try to set their crossover point and slope to essentially follow that same natural rolloff so you combine both the acoustic rolloff of the driver with the electrical crossover and don't alter the phase severely.


Crossover Slope:

The slope you use depends on the following:
Level of attenuation needed. 
This should be self-explanatory. Basically, the steeper the slope, the faster the rolloff.

Phase:

I can't say enough how non-trivial this is. There's the "set it and forget it" method which can be made to work or there's the "spend a lot of time on it until you get it as good as you can" which I propose. The latter option will save you a lot of headaches in the future.
Think of two sine waves. If both are in phase, they play together and the amplitude is increased. If they are out of phase by 180 degrees, they cancel each other out. Your goal at the crossover is to essentially allow one speaker to 'carry' in to the other, without evidence or calling attention to anything in the crossover region. You want in phase sine waves... for a lack of better analogy.
What you will HAVE to do is EXPERIMENT. Using the above crossover frequency info, pick a point that makes sense to start with. From there, change the slope of one driver with respect to another or even both drivers. Take notes. Which settings sounds better? What happens when you change the polarity of the tweeter but leave the midrange polarity the same? What happens if you change the slope of the midrange from 24dB/Octave to 12dB/Octave? Then try flipping it's polarity. 

FWIW, I typically shy away from anything less than Linkwitz-Riley 12dB/octave (LR2 - "2" for second order). The reason why is pretty simple: power handling. If you know me, you know I like some volume. Then there's the case of out of band EQ'ing that may be necessary and if you don't have this ability with your DSP, it's a problem. A steeper slope keeps less information from overlapping. Especially the high frequency content you don't want playing due to beaming and breakup. And for those convinced that low order is the best way to go in a time domain case, keep this in mind: although a 6dB/octave butterworth has no group delay, it doesn't mean your summed response won't result in such. What you care about is the total response. Not just a resistive load single crossover. 


There's no guaranteed slope or crossover point that will work for you. The reason why is because the crossover network that works best is dependent on the characteristics of a single driver (breakup, natural rolloff, distortion) AND the crossover point/slope of the driver you are mating it to!

You will have to experiment. You can use your ears or a mic. I think it's useful to try using your ears as it makes you a more attentive tuner. The mic can do a lot of things great, but it can also mislead you as well. So, you have to really listen in between adjustments made via mic. One thing I suggest is to narrow the best settings down to a few. Then from those, listen. Use pre-sets if you can and switch back and forth between them.

I also recommend using correlated pink noise to help you set your crossovers. The CD link I provided in the Resources section has this. 
Mute everything but the mid and tweeter (or whatever it is you're setting the crossovers on) and listen to them as a pair while you alter the crossover settings. Listen for the sound to be fuller and as one. If you hear more of one driver than another keep in mind this may be simple levels, which we will address later. For now, focus on trying to listen for cohesion at the crossover point, though. If you're crossing your mid and tweeter at about 3khz, don't worry about what's going on at 500hz or 10khz. Pay attention to the 2-4khz range and see how that area changes as you adjust your crossovers' settings. Something else you can try, which is what I do, is to use pink noise 'tones' at the frequency around the crossover point. This is really helpful with time alignment which I'll get in to later as well.

Something else I've noticed is when the two drivers are out of phase, I'll hear a phantom image in front of me; away from the drivers I'm tuning. It's a total mind trip. 

Finally, your goal is to get it as close as you can. It likely won't be perfect, because most car installs require a large delta between drivers and thus there will most likely be lobing (this is again why #1 in theCrossover Frequency section is important) but what you should find is after spending some QUALITY time doing this, you'll have a much fuller soundstage and more cohesion between drivers. Time alignment can be used to further tweak this. That's for later, though. Right now, focus on getting the crossover point and slope as dialed as possible between each set of drivers. 


Additional Crossover Notes:

While the previous section focused on a single driver characteristics and understanding them, the import factor is the implementation of a driver in a system… with other drivers. 

Good power response should be your goal but it’s not easy.
For example, mating a 1” tweeter to an 8” woofer isn’t as easy as mating a 1” tweeter to a 6” woofer. Why? Because the tweeter doesn’t have to cross as low to match the 6” woofer’s dispersion. If you tried to cross the tweeter to match the 8” woofer, you’d increase the tweeter non-linear distortion considerably. Conversely, if you increased the 8” driver’s low pass filter you’d likely exceed it’s beaming point and the dispersion wouldn’t match between the mid/tweeter.


Let's look at another example using a typical 2-way setup:
A typical 2-way setup consists of a 6.5” woofer and ¾” tweeter. The following is a generic analysis based on typical drivers:
¾” Tweeter Crossover:
THD reaches 3% at 2khz (raw driver)
6.5” Woofer Crossovers:
Most 6.5” woofers with moderate linear throw (3-5mm one-way) have 3% THD by 80hz.
Fs/Qts will drive the enclosure which drives Qtc which drives the crossover as well. A lower value Qtc means less cone control and more attention should be placed here to not damage the suspension or fry the voice coil.
Beaming will occur by about 1.2khz with an effective diameter of 6”. Based on this, you can assume a 2khz would suffice to keep the driver’s on and off-axis response fairly well matched. Much higher above this and the separation is more severe.
Therefore, a nominal crossover point between mid and tweeter in this generic example would be in the 2khz – 3khz range, in order to mitigate woofer breakup and beaming but also to lessen tweeter distortion. Crossing the woofer above 80hz on the low end will help mitigate it’s distortion at higher volumes.

Distortion in Speakers


Distortion:

There are two types of distortion:

Linear:
Any divergence from flat in the frequency response would be considered a form of linear distortion.
No driver is completely flat. Though, typically below the beaming point, drivers are fairly flat. 

Outside of beaming is where breakup occurs and is typically the area where linearity in response is compromised.

Does not change with volume.

This is typically used to determine low-pass values as cone break-up is the worst offender after the beaming point.

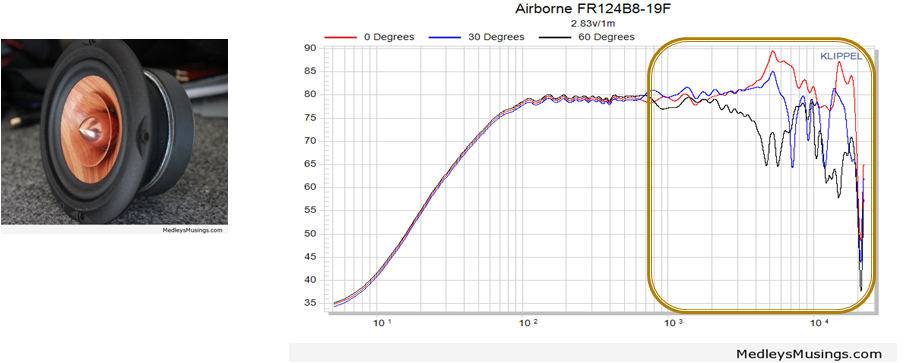
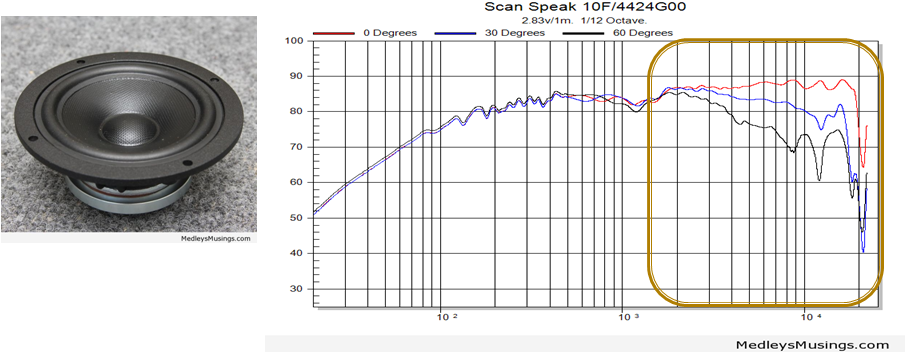
Below is an example of poor linear performance. Notice after the beaming point of this 4” fullrange driver how it’s on and off-axis measurements differ?


Below is an example of good linear performance. Notice after the beaming point of this 4” driver how it’s on and off-axis measurements follow the same trend?


Non-Linear:

Distortion that changes with volume.

Referred to as harmonic distortion, THD, etc.

This is typically used to determine your high-pass values.

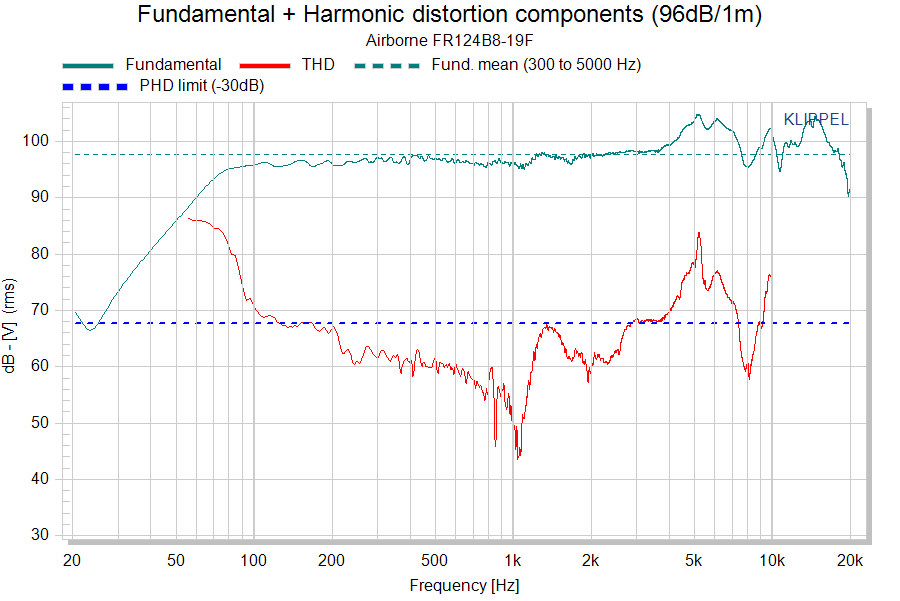
While argued as to it’s merit of audibility, a good rule of thumb is to avoid the 3% THD range (Note: 

3% THD is 30dB down from the fundamental).

Below is the measured distortion of a 4” fullrange driver. Note the THD has reached the 3% mark at about 150hz. In addition, high frequency breakup exceeds 3% THD at approximately 3khz.

What is Acoustic Roll Off

Acoustic high-pass:

Fs – Free air resonance of a driver
Qts – Bandwidth of driver resonance


Fs and Qts can be obtained by manufacturer Thiele-Small specs or derived by an impedance chart if available:


Acoustic low-pass:

Determined by things such as motor force, suspension, and (namely) inductance.
If the inductance (essentially resistance to current, for our purposes) is high, the output of the speaker is less, regardless of the axis.

What is Beaming in Speakers


Beaming is kin to the acoustic low-pass (discussed in the following post).

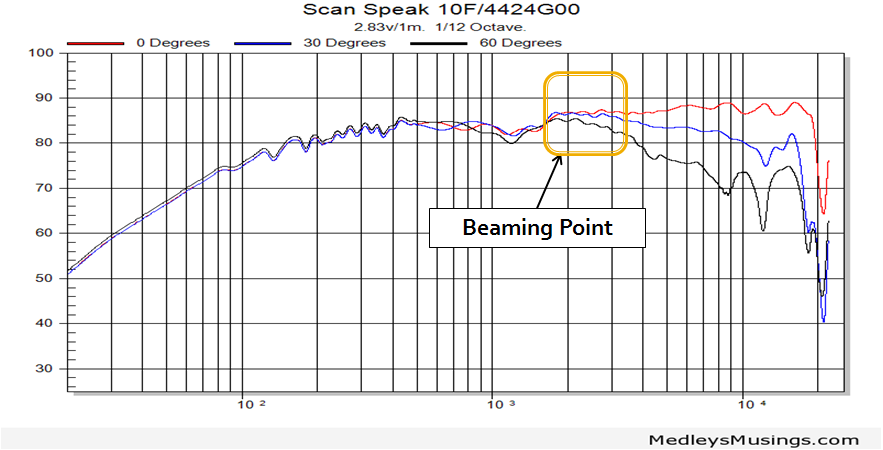
Beaming is a function of the effective driver size: the dispersion narrows as the wavelength (frequency) becomes smaller than the size of the drive unit.
Note: Effective driver size is taken from 1/2 surround to 1/2 surround.
All drivers beam! Though, some drivers are built to extend further on a given axis than others, but often at a cost (sensitivity, cone breakup, etc).
Frequency response measurements illustrate beaming easily; look for the on and off-axis responses to diverge. This is your beaming point.
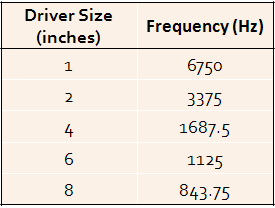
The formula to approximate the beaming point is: 0.5*(Speed of Sound)/(Driver Size). 
Note: This is for the case of a conical driver. The same formula applies for square/rectangular/oval shaped drivers. In this case you simply use the dimension to determine the vertical or horizontal beaming point. For instance, a 5x7" driver doesn't have a uniform polar pattern; it will beam at the 5" and 7" dimension so therefore you will have a different response on/off axis vertically and horizontally (depending on how the driver is oriented to the measurement device).
Below is a table illustrating approximate beaming points for a round driver with a given cone diameter: 


In the example below of a 4” midrange with an effective diameter of about 3”, beaming occurs approximately at 2khz.

Basics of Drivers

Basics of Drivers


The following sections are intended to help you understand the important aspects of a raw driver and data which will then lead to helping determine nominal crossover points.


Response Types:

Frequency Response:
The measure of frequency (Hz) vs amplitude (dB) across a given range
Multiple frequency response measurements at varying axes are taken to show how the driver behaves in all directions. Those axes are comprised of the following:

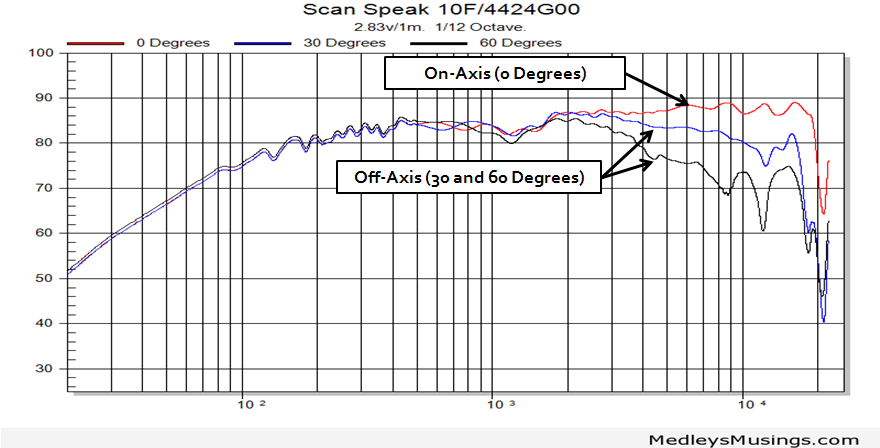
On-axis response: Speaker/system response when the listener is directly facing the speaker (SINGLE POINT).
Off-axis response: Speaker/system response when the listener is anywhere EXCEPT directly on-axis (typical range is 15 to 90 degrees off-axis in car).
Ideally, the frequency response will indicate no hot or cold spots in response as the listener/measurement mic moves around the speaker
The driver or speaker shall maintain it’s general response, other than a decreasing output level as the frequency gets higher
Below is the frequency response on-axis (0 degrees) and off-axis (30 and 60 degrees). Note the graph legend in addition to callouts.


Polar Response:
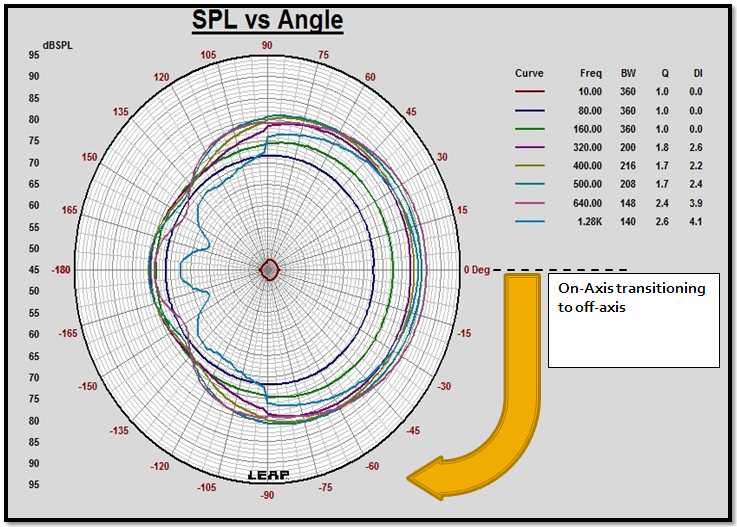
Another way of relating frequency response using a particular frequency or frequencies, mapped out in a polar pattern, representing the directivity of a speaker at varying angles (ie; as you move from 0 degrees on-axis to any angle off-axis)
Below is a polar response example of a speaker modeled in LEAP. The model was derived based on a simulated horizontal axis measurement ranging from 10hz to 1.28khz. You can see that as the frequency increases, the radiation changes from omnidirectional to more directional. 


Power Response:
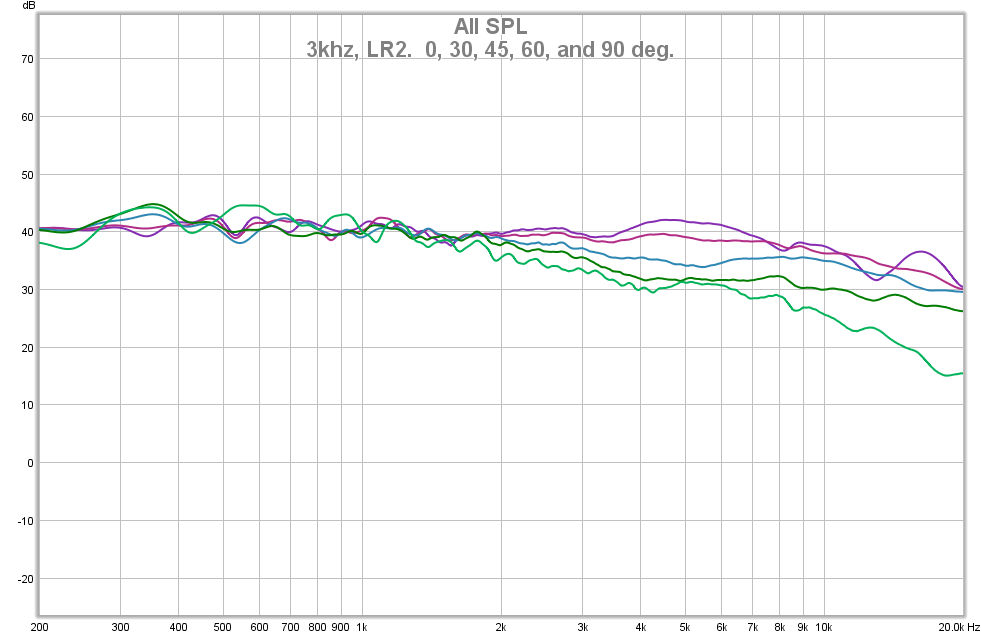
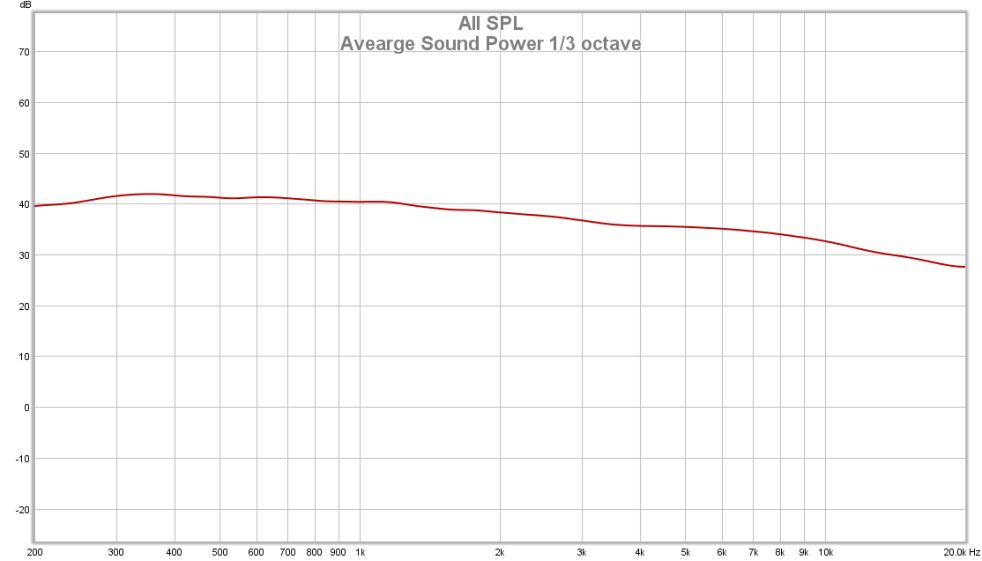
Single measurement which is the sum total of both direct and reflected sounds and is a representative example of what the listener will hear at a given location
Typically an average of multiple measurements in the listener’s head area

An “ideal” power response is one with no significant peaks or dips caused by irregularities from any single axis of measure
The total response shall roll-off smoothly. The rate of roll-off is a matter of directivity index.
When you RTA and average the results, power response is what you are measuring.
The picture below shows a speaker measured both on and off-axis in varying axes. The subsequent picture is an average of all these measurements, which results in the power response measurement.


The complete guide to using iTunes with lossless audio

While you might not notice the difference in sound quality, the lossless format leaves you with an archival file that you can convert at any time in the future. You’ll never need to rip those CDs again.

I regularly get questions about lossless audio files, or files compressed in a lossless format, for my Ask the iTunes Guy column. These questions come from people who seek to listen to the best quality audio files with iTunes. But many iTunes users don’t know what these files are.
In this article, I’m going to explain what lossless audio files are, how to create them, why you might want to use them, and why you might not.
What is compression?
Let’s start with a simple question: what is compression? You’ve probably familiar with Zip compression, which lets you shrink the size of a Word file or a PowerPoint presentation for storage or to send to someone by email. When you unzip—or decompress—the archive, the resulting file contains the exact same data as in the original. This seemingly magical compression algorithm looks for redundancies in data, and writes a sort of shorthand, saving a great deal of space.
With audio files, there are two types of compression: lossy and lossless. The former is the way files such as MP3s and AACs are shrunk to one-quarter, even one-tenth the size of the original files. This type of compression removes data for sounds that you can’t hear, as well as using other “psychoacoustic” techniques to compact the files.
Lossless compression for audio files allows you to take an original music file—on a CD, for example—and shrink it to save space, yet retain the same quality. It’s not as small as a lossy compressed file, but when you play it back, the file is decompressed on the fly, and the resulting data is exactly the same as the original. This is similar to the way a Zip file of a Word document containing the text of Moby-Dick has all the same words when it’s uncompressed.
File formats
iTunes handles several audio file formats:
WAV and AIFF are uncompressed audio files, which encapsulate the data on a CD (or converted from a studio master) in a way that the files can be read on a computer.
Apple Lossless is a lossless format, which retains the full quality of the uncompressed audio, yet uses much less space; generally about 40 to 60 percent less than WAV or AIFF files.
AAC and MP3 are both lossy compressed formats. AAC is actually the MP4 standard, the successor to MP3.
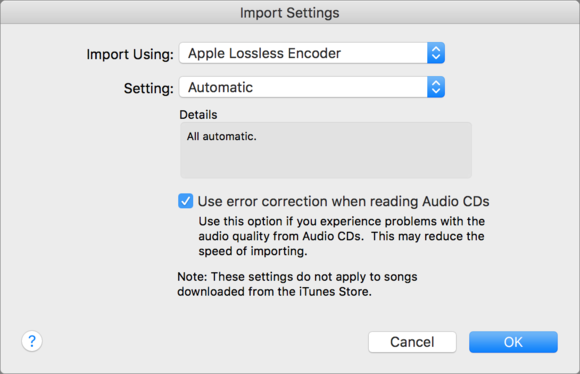
You choose which format you use to rip CDs and convert files in iTunes in the General preferences. Click Import Settings, then make your choice.
import settings
iTunes import settings; here I’ve selected Apple Lossless.
These different formats have different bit rates, and, as such, result in files of different sizes. Here’s an example; I ripped a song in three different formats:
rip three formats
You can see that the AIFF file is the largest. The Apple Lossless file is smaller, and the “iTunes Plus” format rip, at 256kbps, is even smaller.
The AIFF file will always be 1411kbps; that’s the bit rate of music on a CD. The Apple Lossless file’s bit rate and size depend on the density and complexity of the music. And the AAC (or MP3) file will be at the bit rate you  choose unless you opt for a true VBR (variable bit rate file), where the bit rate will be near a target bit rate. (Apple’s iTunes Plus format is a sort-of-VBR.)
Note that it’s generally not a good idea to use AIFF or WAV files in your iTunes library. Not only do they take up a lot of space, but tags—metadata you add to the files—aren’t supported as well as with the other formats. While you can tag WAV and AIFF files in iTunes, not all of these tags remain in the files if you move from your iTunes library to another computer or device.
Why rip to lossless?
You have the option to rip your CDs to Apple Lossless format. You may also have some FLAC (Free Lossless Audio Codec) files you’ve downloaded; they’re very common. But why use lossless files? 
What’s the advantage?
As you’ve seen above, lossless files take up a lot more space. So if you have a large music collection, you’ll need a bigger hard drive (or more than one). And lossless files sound exactly like CDs, so you’ll have the best quality for your home listening. Also, if you rip to lossless, you’ll have archival files, which you can later convert to any format without needing to re-rip your CDs.
However, if you’re listening on the go—on an iPhone, with headphones, or streamed to a portable speaker—there’s little advantage to using lossless files. You won’t hear any difference in sound quality over the ambient background noise, and on headphones that are certainly not as good as those you use at home. And these files take up a lot of space on a device that has a limited amount of storage.
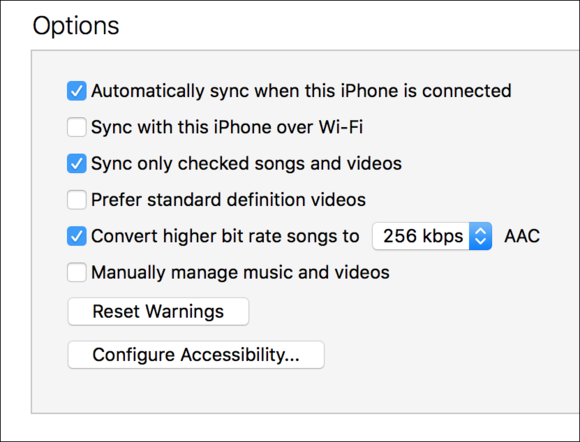
Fortunately, iTunes lets you have the best of both options. Connect your iOS device, select it, and then click on Summary. In the Options section, check Convert higher bit rate songs to, and choose a bit rate. I use 256kbps, but you can also choose 128 or 192. This setting tells iTunes to convert your lossless tracks on the fly when syncing to your iOS device.
itunes convert
Have iTunes convert your lossless files on the fly when syncing to your iOS devices.
Converting files to Apple lossless
I mentioned above that you may have FLAC files that you’ve downloaded, either from websites where bands allow trading of live music or from vendors who sell lossless files in that format. While iTunes doesn’t support FLAC files, you can simply convert them to Apple Lossless, retaining the same quality. See this article for more on this conversion.
Using iTunes Match or iCloud Music Library with lossless files
You may want to use iTunes Match or iCloud Music Library to keep your iTunes library in the cloud. If your iTunes library contains lossless files, iTunes Match and iCloud Music Library treat them differently from other files. If the files are matched, then they’re matched to the iTunes Store equivalents: files at 256kbps AAC. If iTunes can’t match them and needs to upload them, iTunes converts them to 256kbps before uploading. This means that your lossless files will never be in the cloud.
However, if you use the cloud to listen to files on the go, you don’t need them to be lossless, as I explained above. So this might be the ideal solution: keep lossless files in your iTunes library, and use the matched or uploaded versions on your iOS devices.
One more thing: Is it worth re-ripping CDs to a lossless format?
I get this question a lot. It’s a big job to re-rip a CD collection. I would say that if you’re satisfied with the way your rips sound, then don’t bother. If not, you might want to consider re-ripping CDs, especially if you have old rips you made at very low bit rates, back when storage was more expensive, such as 128 or even 96kbps. If you do, and you can afford enough storage, think about ripping to lossless. While you might not notice the difference in sound quality, you’ll have an archival file that you can convert at any time in the future. You’ll never need to rip those CDs again.

Wednesday, 13 April 2016

Making the SQ enclosure (JBL)


Ok, here is the enclosure part, as i mentioned earlier that it was very tricky to get right, but in the end it made my day.

2.32 Cubes Vented at 28 Hz
1.75 Cubes Vented at 33 Hz (Manufacturer Spec)
1.50 Cubes Sealed 
1 Cube Sealed (Manufacturer Spec)


Frequency Amplitude Response


Sysytem Impedance


Cone Excursion


  • Enclosure is made by 0.75" Mdf, double baffled.
  • Its 2.5 cubes gross/ 2.32 cubes net vented at 26.2 hz (+ - 1 hz).

As you can see in the pictures that I have given it a very tight port area of 1.5" to keep the 40-80hz region crisp. The group delay after 34hz is almost similar to the sealed enclosures and just rises above the SQ threshold of 14ms in 20's region. Which is fine indeed because typical music dont have any info below 35hz except some rap.

The highs region is crisp to blend well with the front stage and lows region are deadly as expected by this kind of tuning and sub potential. It was basically a experiment which went beyond my expectations.


Firstly the holes in the trunk lids were stuffed by polyester balls. After some extreme stuffing, holes were sealed. Lanbo sheet was pasted followed by 1" thick jumbolon. After all this a carpet was installed by the clips on default locations to give the lid a Oem look.


Crossover Theory

I am only using the lpf on mid and hpf on tweets from the krx3 crossovers. One bad slope and it goes crazy and phase is difficult to get cohesive.

The idea of using mids close with tweets generate when you want your system to be cohesive. It is true for mid bass drivers as well but a trade off because when can't put mid bass upfront. And also imaging cues and height cues are in 800hz to 4khz region.
No compromise on these ranges because they define the stage and imaging therefore with a minimal centre to centre spacing, these ranges can be very cohesive. I don't want to fix the PLD's with TA because you just won't be able to get it in phase.

The formula of deriving a frequency between two drivers is there for a reason. Single point source is attained by keeping the drivers within one quarter of wavelength.

Focal KRX3, The Ultimate 3 WAY French Components !

Finally crossed the border


Really wanted them and got them. Sun is about to come out for a shine

Some random shots of install


The 80prs siting on top


Final aiming on mids and highs. The pods have been bolted temporarily till the fg work is done.


I had a long chat with Mr. Wingate. He is the official representative of Focal America on Diyma. He has almost forced me to use them off axis. As he is involved in the designing processes therefore I have to acknowledge his suggestion.


Pillars and Small spacer behind the pods are fabricated.